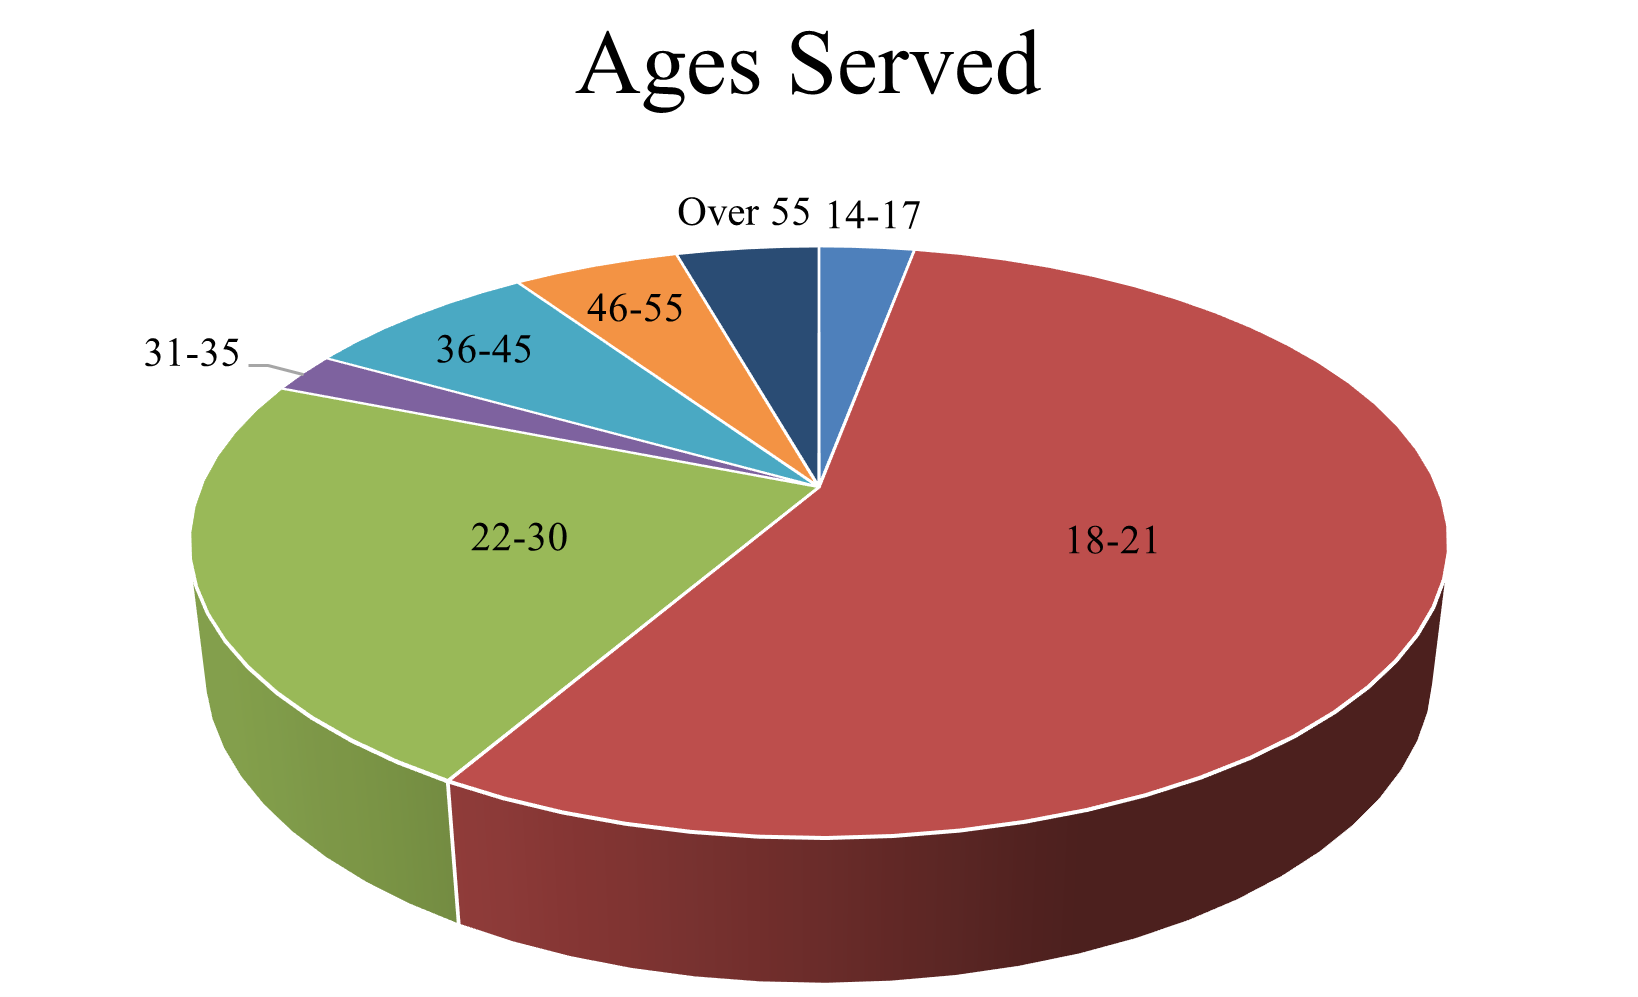
During FY25, the EDC served 56% of individuals aged 18–21 years, 23% aged 22–30 years, 7% aged 36–45 years, 5% aged 46–55 years, 4% over 55 years, 3% aged 14–17 years, and 2% aged 31–35 years.
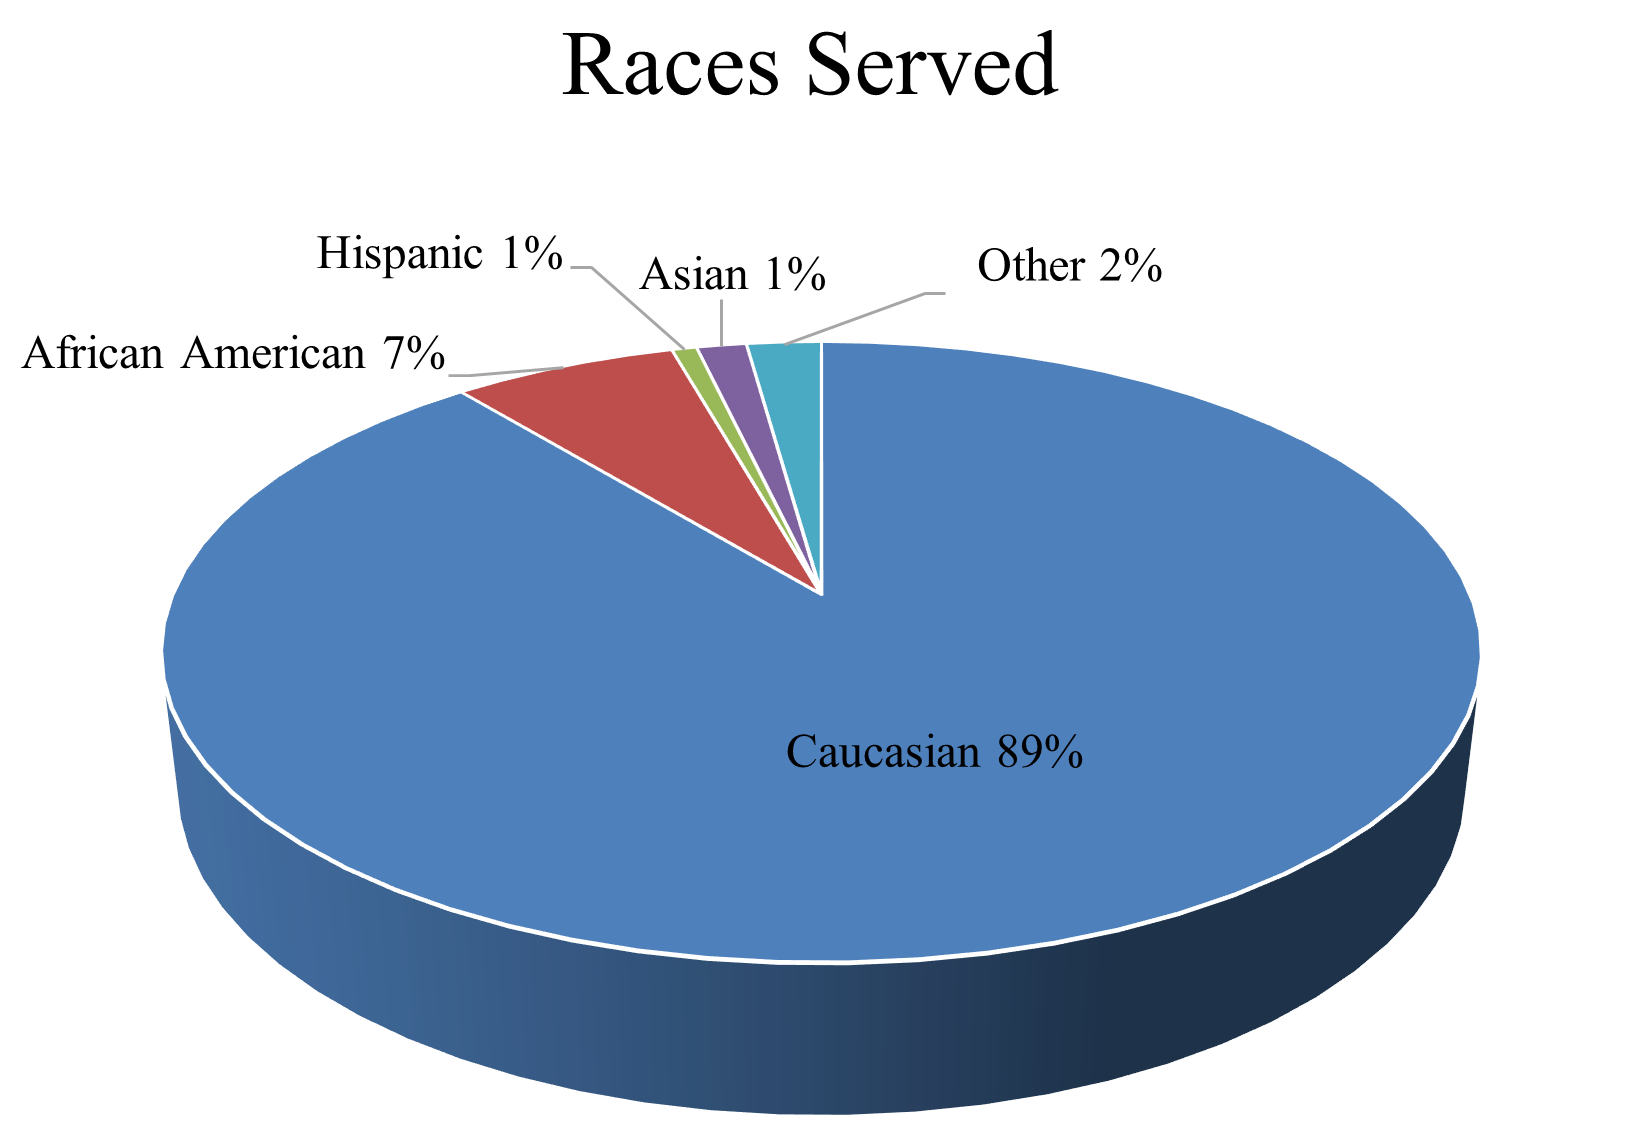
In FY25, the EDC served 89% of individuals that identified as Caucasian, 7% of individuals that identified as African American, 1% of individuals that identified as Asian, 1% of individuals that identified as Hispanic, and 2% of individuals that identified as ‘other’.
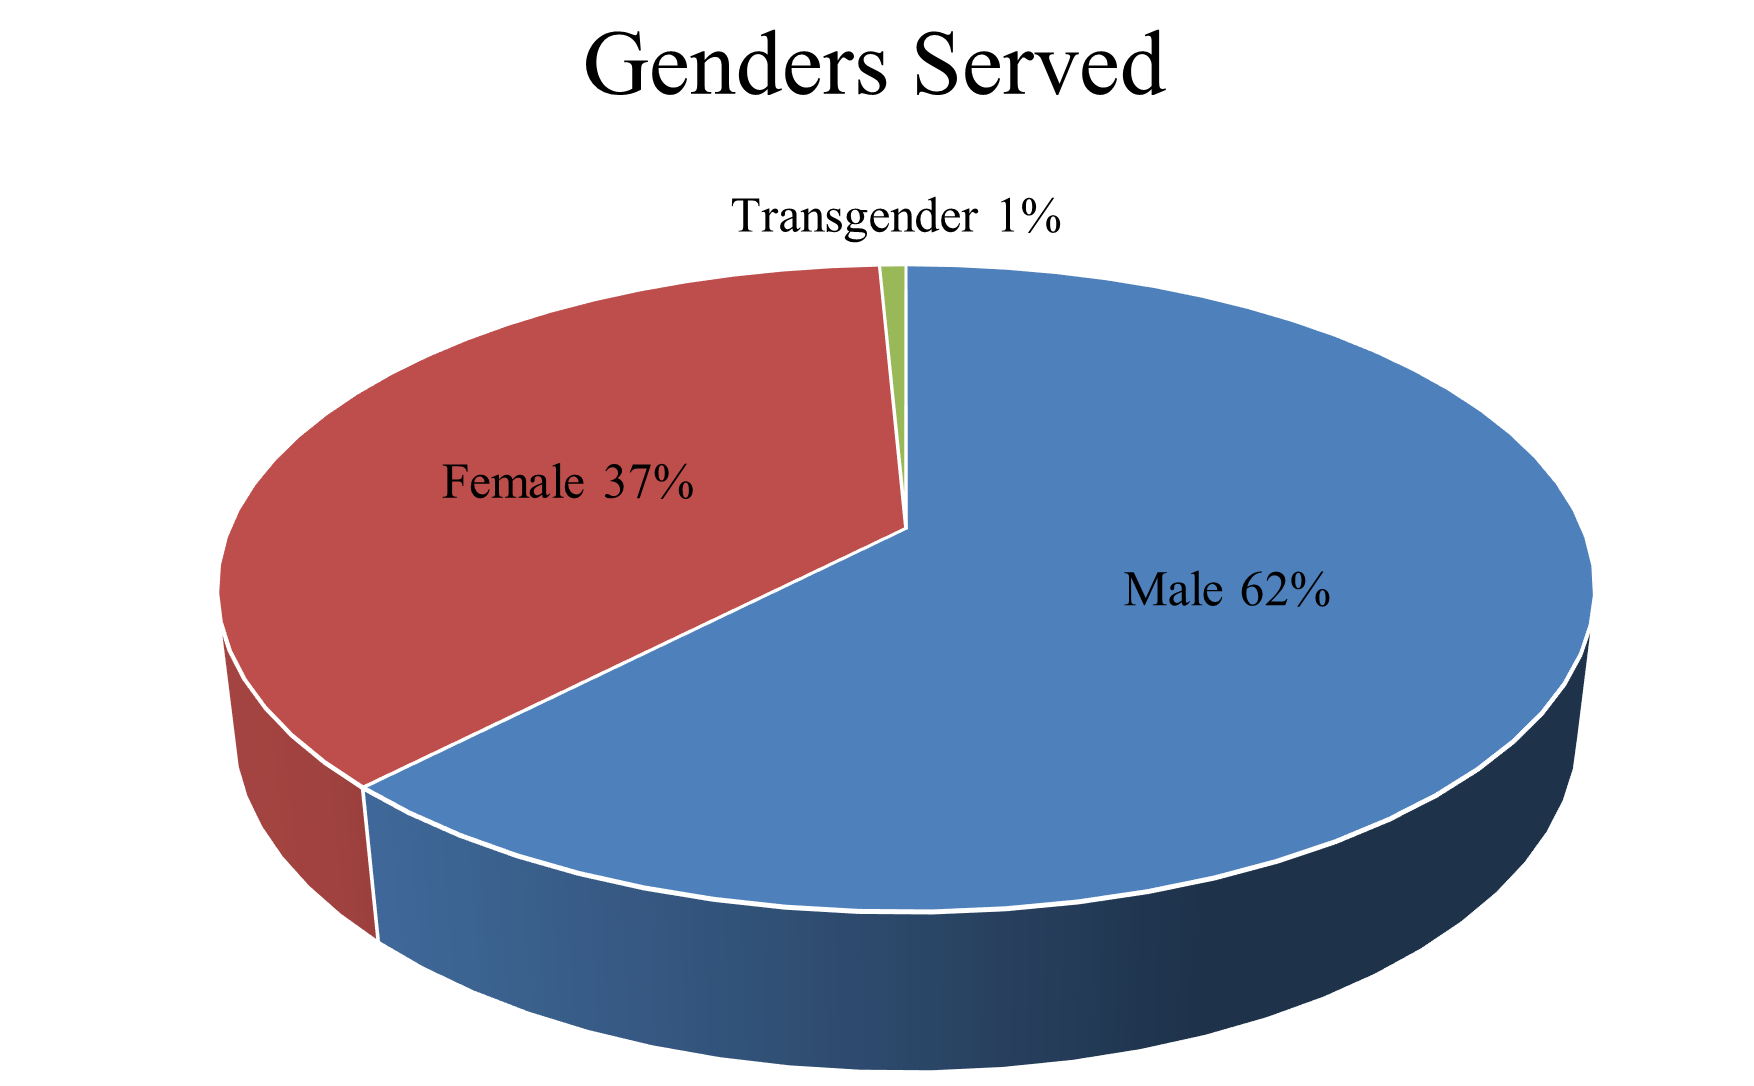
During FY25, the EDC served 61% of individuals that identified as Male, 37% of individuals that identified as Female, and 1% of individuals that identified as Transgender.
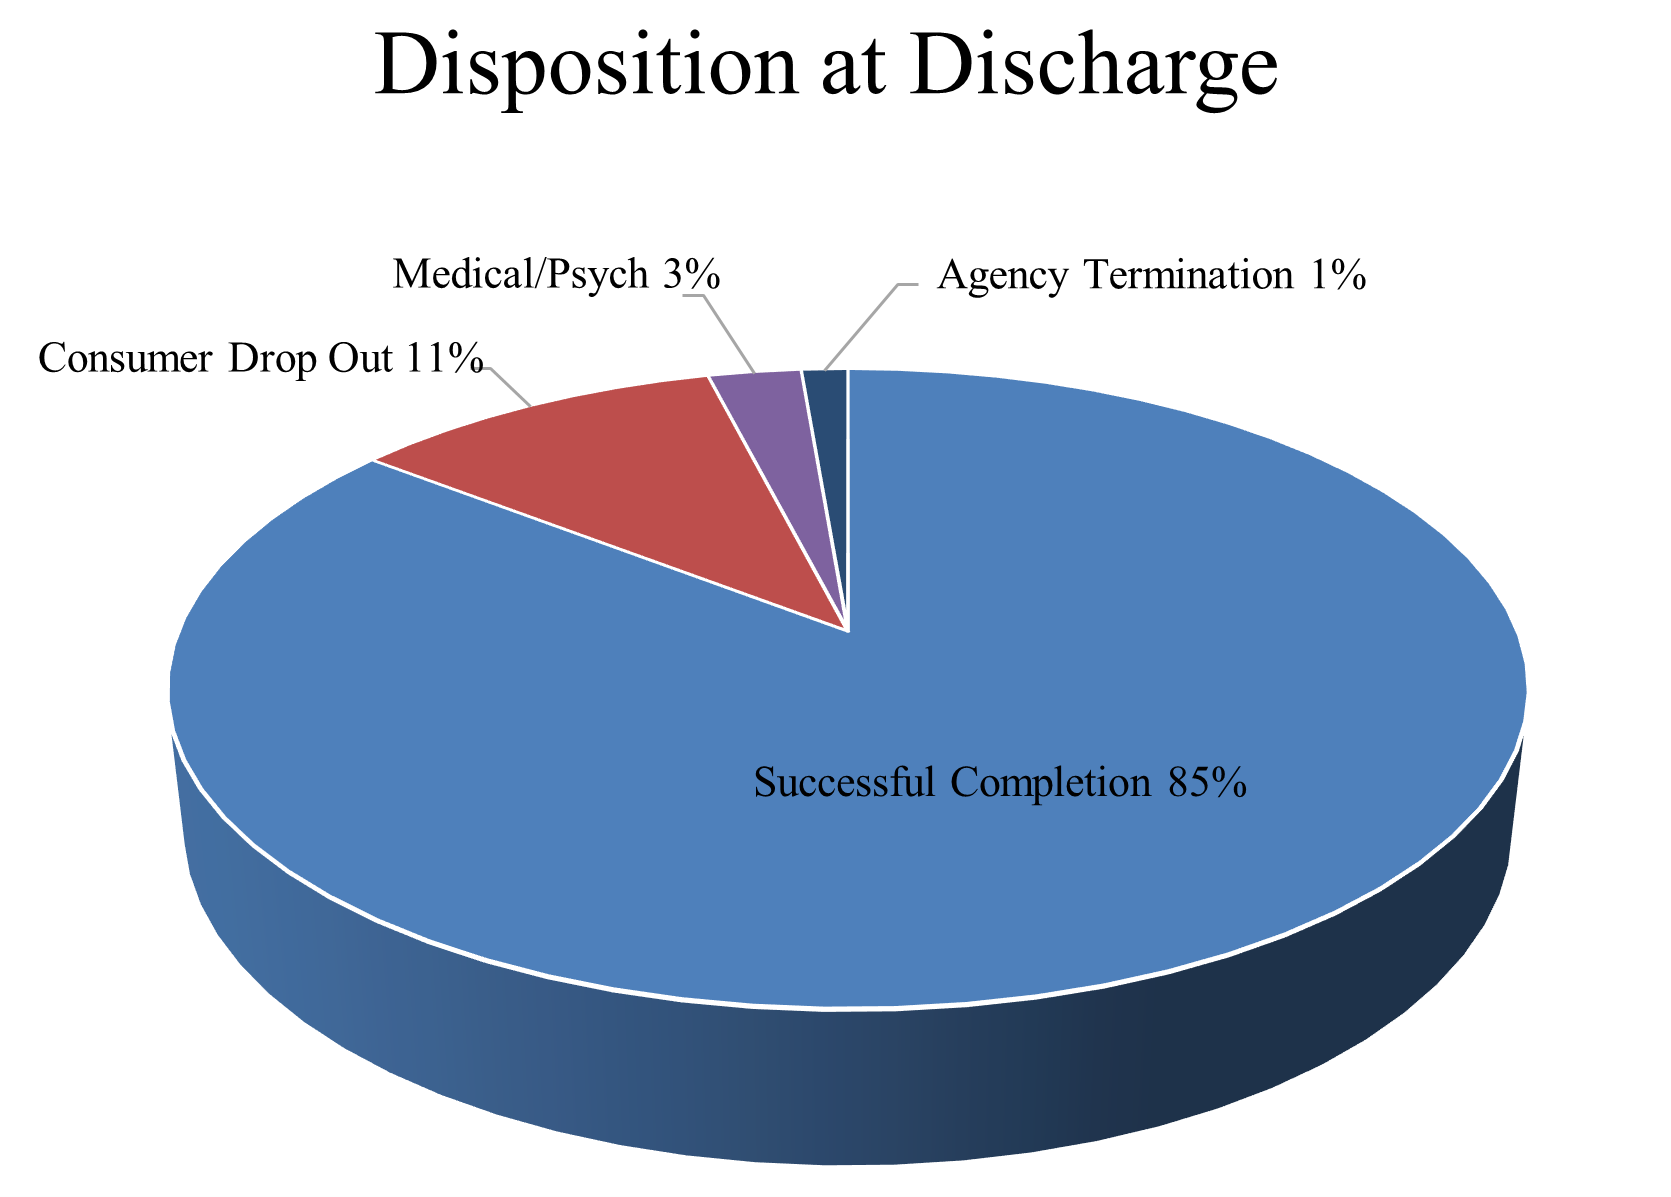
During FY25, the EDC served 86% of individuals that completed their programming at EDC successfully, and 3% of individuals received medical/psych intervention following discharge. Approximately 10.5% of individuals prematurely dropped out of EDC programming during the FY25.
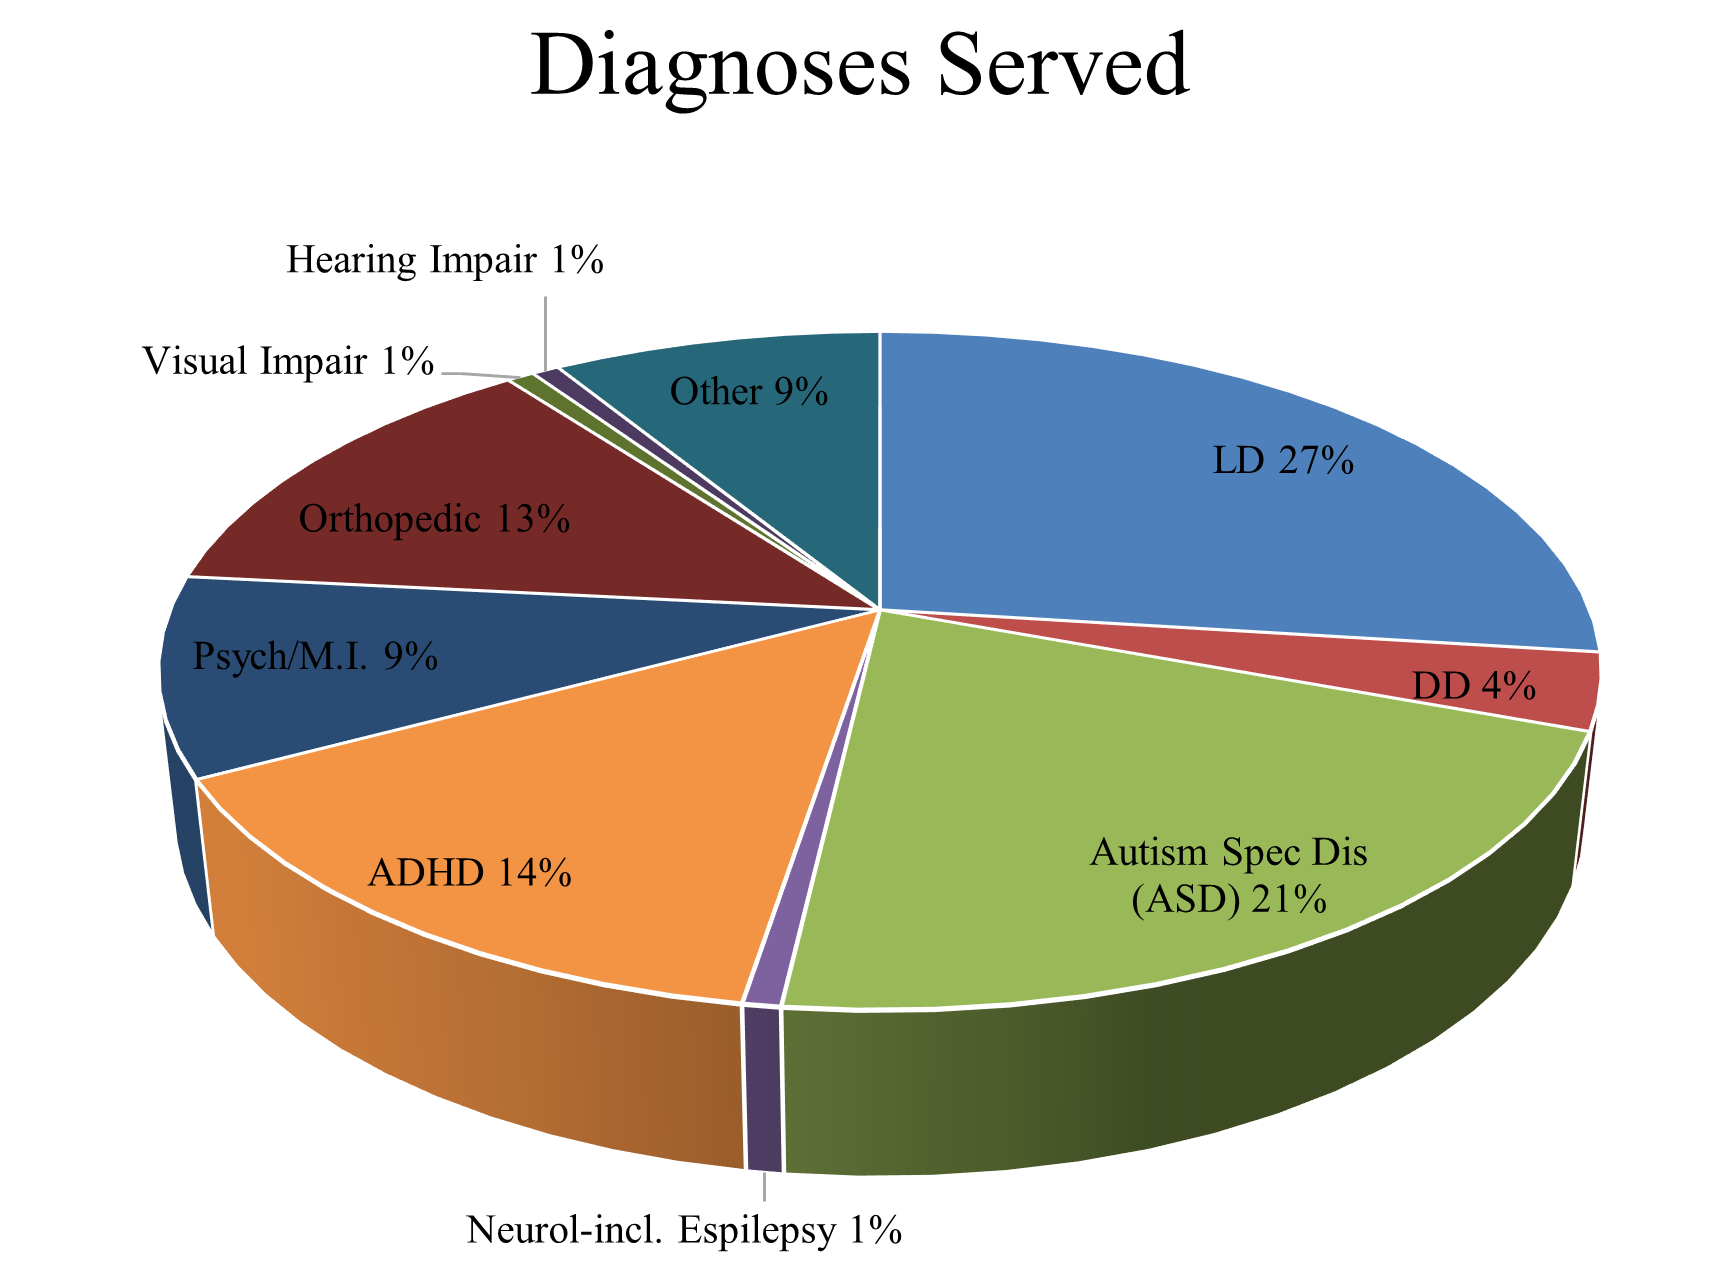
Primary diagnoses of individuals served are shown in the chart. During FY25, the EDC served 27% of individuals diagnosed with a Learning Disability, 21% of individuals diagnosed with Autism Spectrum Disorder, 15% of individuals diagnosed with Attention Deficit-Hyperactivity Disorder, 13% of individuals diagnosed with an Orthopedic condition, 9.5% of individuals diagnosed with a Psychiatric/Mental Illness, 4% of individuals diagnosed with a Developmental Disability other than ASD and ADHD, 1% of individuals diagnosed with a Hearing Impairment, 1% of individuals diagnosed with a Visual Impairment, 1% of individuals diagnosed with Epilepsy, and 9% of individuals diagnosed with other disabilities.